
![]()
![]()


UPDATE: robvis now exists as a web-app, aimed at those who are not familiar with R or who want to explore the package’s functionality before installing it locally.
Description
The robvis (Risk-Of-Bias VISualization) package facilitates the rapid production of publication-quality risk-of-bias assessment figures, correctly formatted according to the assessment tool used.
The motivation for this package is more fully described in the (open access) article introducing the tool, available here.
Getting started
Install the development version which contains new functionality and a range of bug fixes:
install.packages("devtools")
devtools::install_github("mcguinlu/robvis")
To update the package, run the install_github("mcguinlu/robvis") command again.
If you wish to use the older CRAN version of the package, use the following command:
install.packages("robvis")Load data
To load your own data from a .csv file:
mydata <- read.csv("path/to/mydata.csv", header = TRUE)To help users explore robvis, we have included example datasets in the package, one for each of the tool templates that currently exist within the package. The data_rob2 dataset (view it here), which contains example risk-of-bias assessments performed using the RoB2.0 tool for randomized controlled trials, is used to create the plots in subsequent sections.
Create plots
The package contains two plotting functions:
1. rob_summary()
Returns a ggplot object displaying a bar-chart of the risk of bias of included studies across the domains of the specified tool. [Note: the defaults used in this function have changed from their original settings, so that a un-weighted barplot is now produced by default. See the NEWS.md file for further information.]
summary_rob <- rob_summary(data = data_rob2, tool = "ROB2")

summary_rob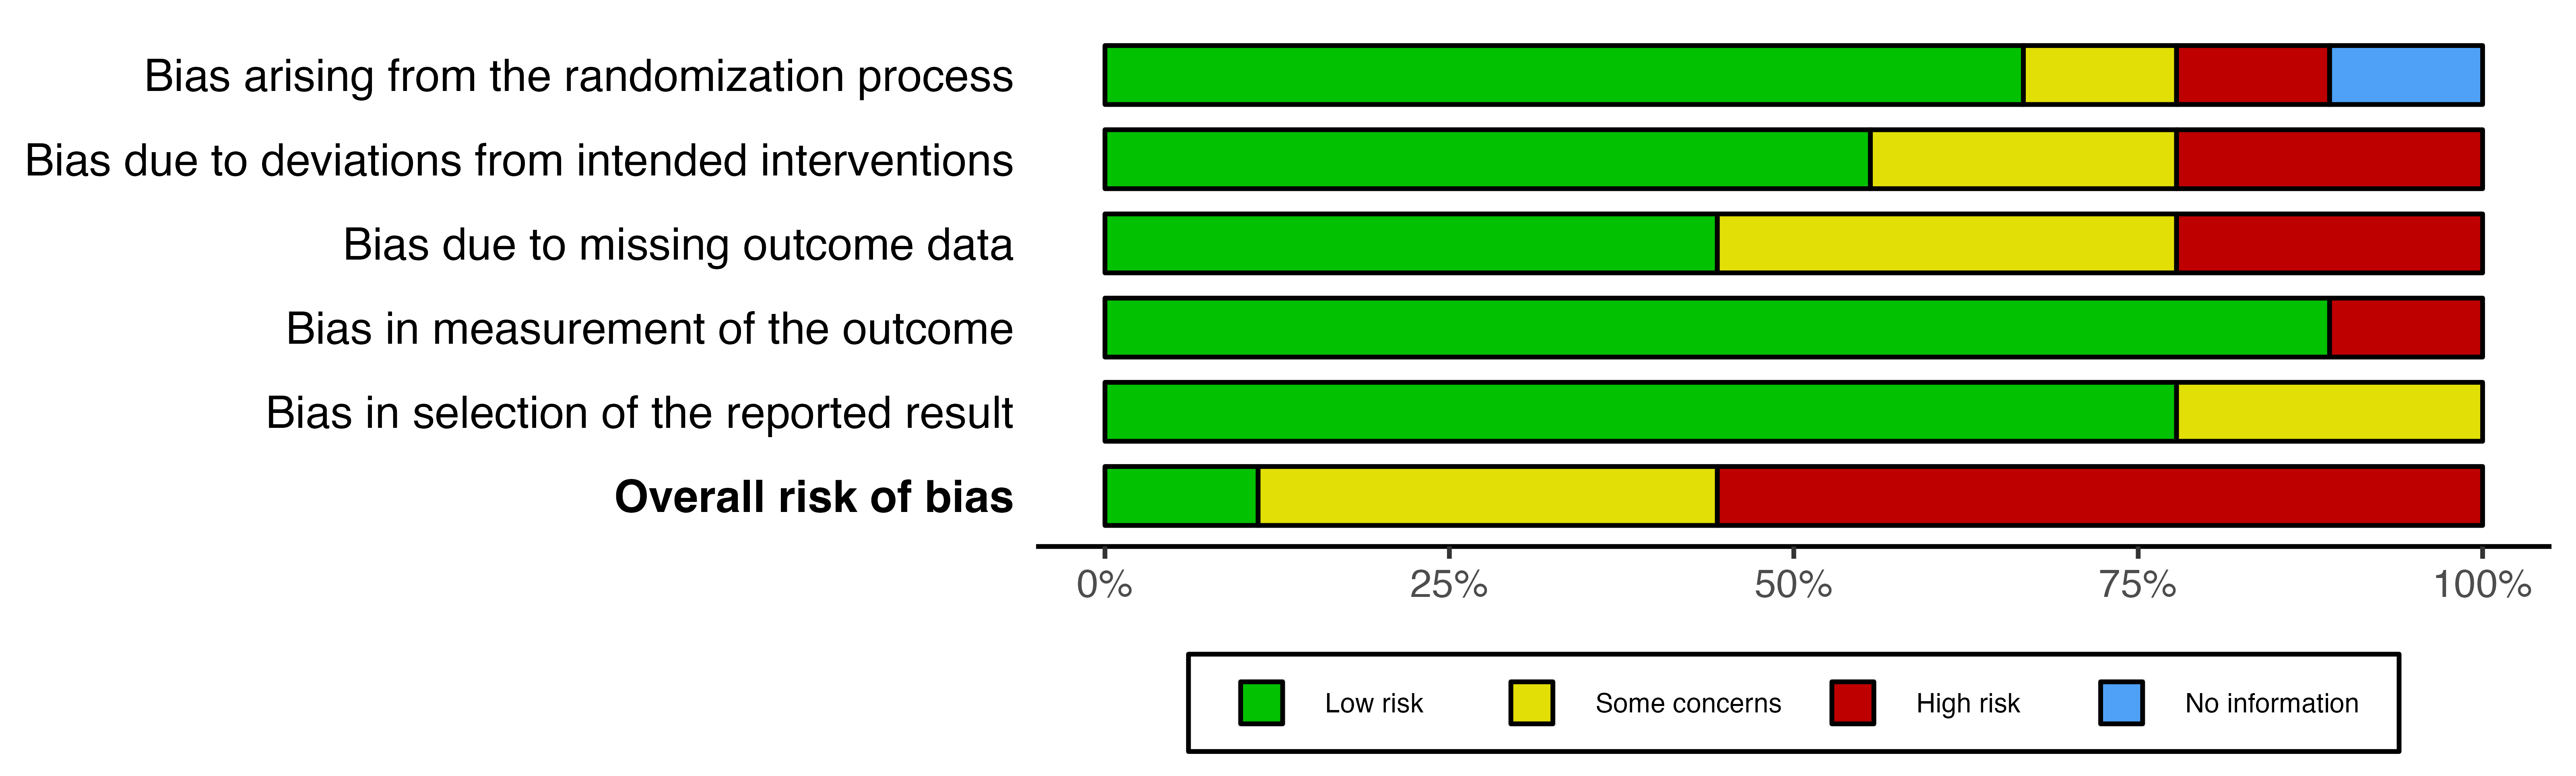
2. rob_traffic_light()
Returns a ggplot object displaying a “traffic light plot”, displaying the risk of bias judgment in each domain for each study.
trafficlight_rob <- rob_traffic_light(data = data_rob2,
                                      tool = "ROB2",
                                      psize = 10)

trafficlight_rob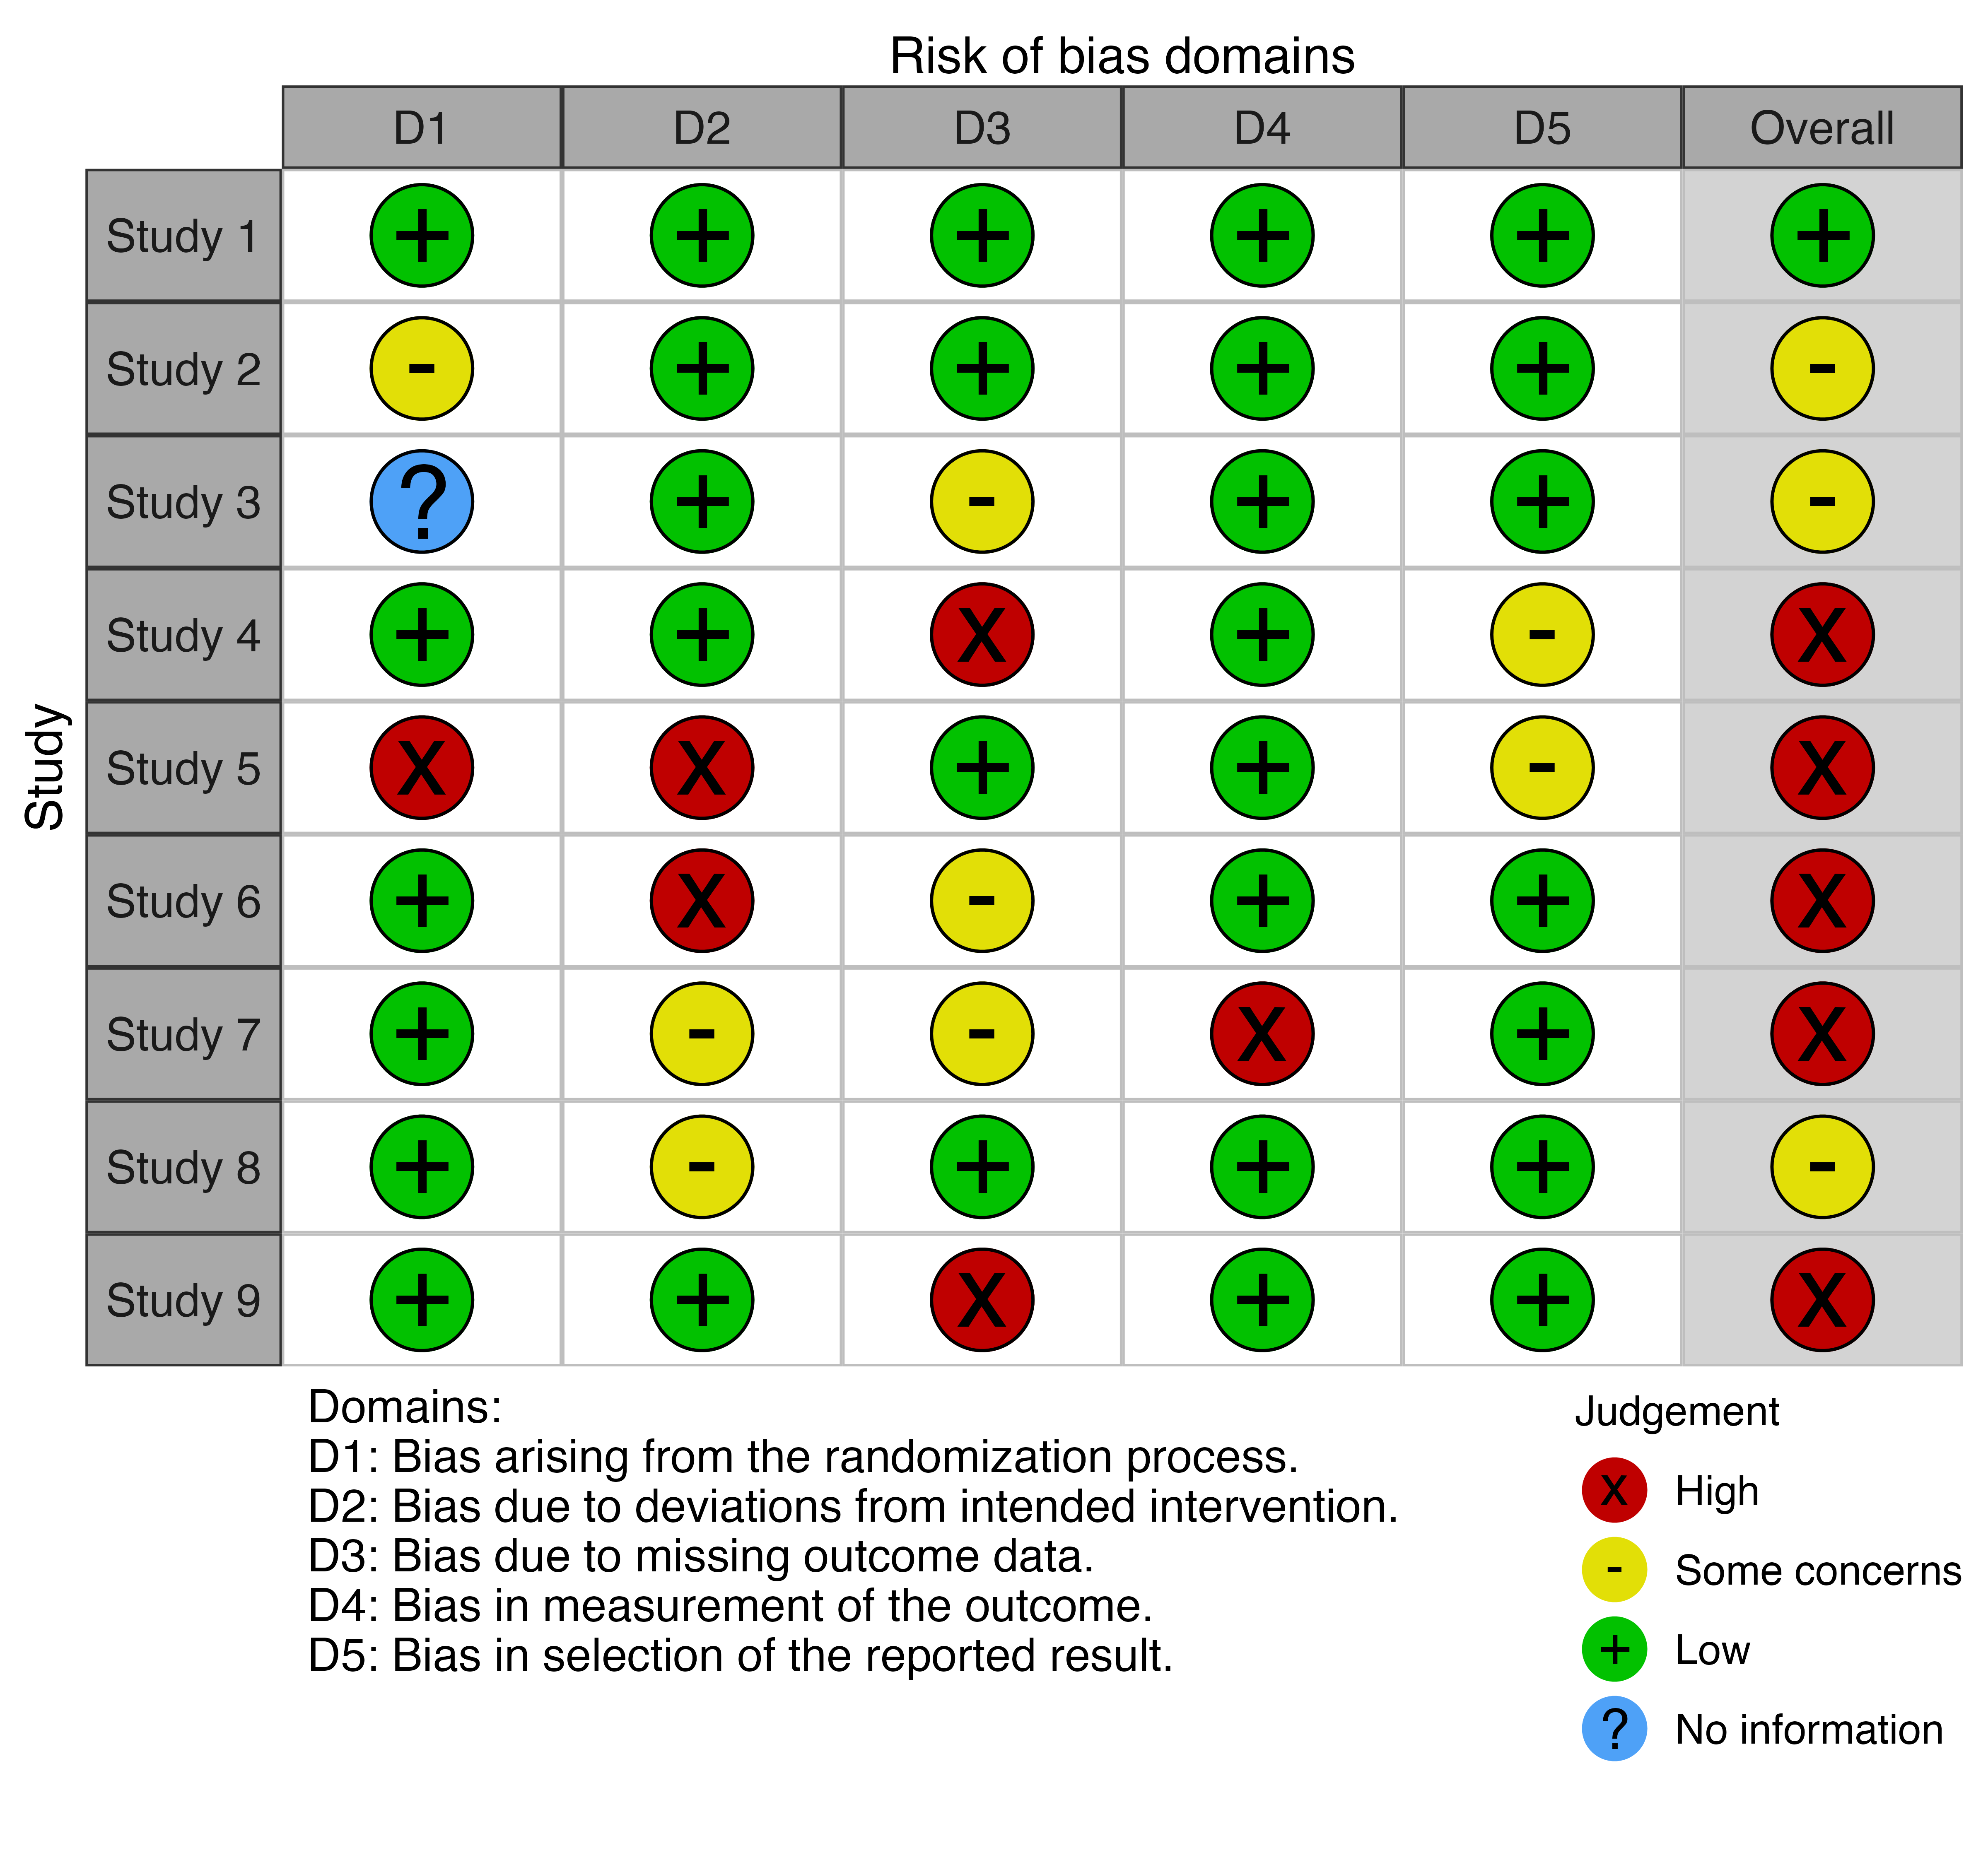
Other functions
rob_save()
Pass the robvis to this function, along with a destination file, to save your risk-of-bias plots using sensible defaults.
rob_save(trafficlight_rob, "rob_fig.png")rob_tools()
Outputs a list of the risk of bias assessment tools for which a template currently exists in rob_summary(). We expect this list to be updated in the near future to include tools such as ROBIS (tool for assessing risk of bias in systematic reviews).
rob_tools()
#> Note: the "ROB2-Cluster" template is only available for the rob_traffic_light() function.
#> [1] "ROB2"         "ROB2-Cluster" "ROBINS-I"     "ROBINS-E"     "QUADAS-2"
#> [6] "QUIPS"        "Generic"
Advanced usage
Change the colour scheme
The colour argument of both plotting functions allows users to select from two predefined colour schemes (“cochrane” or “colourblind”) or to define their own palette by providing a vector of hex codes.
For example, to use the predefined “colourblind” palette:
rob_summary(data = data_rob2,
            tool = "ROB2",
            colour = "colourblind")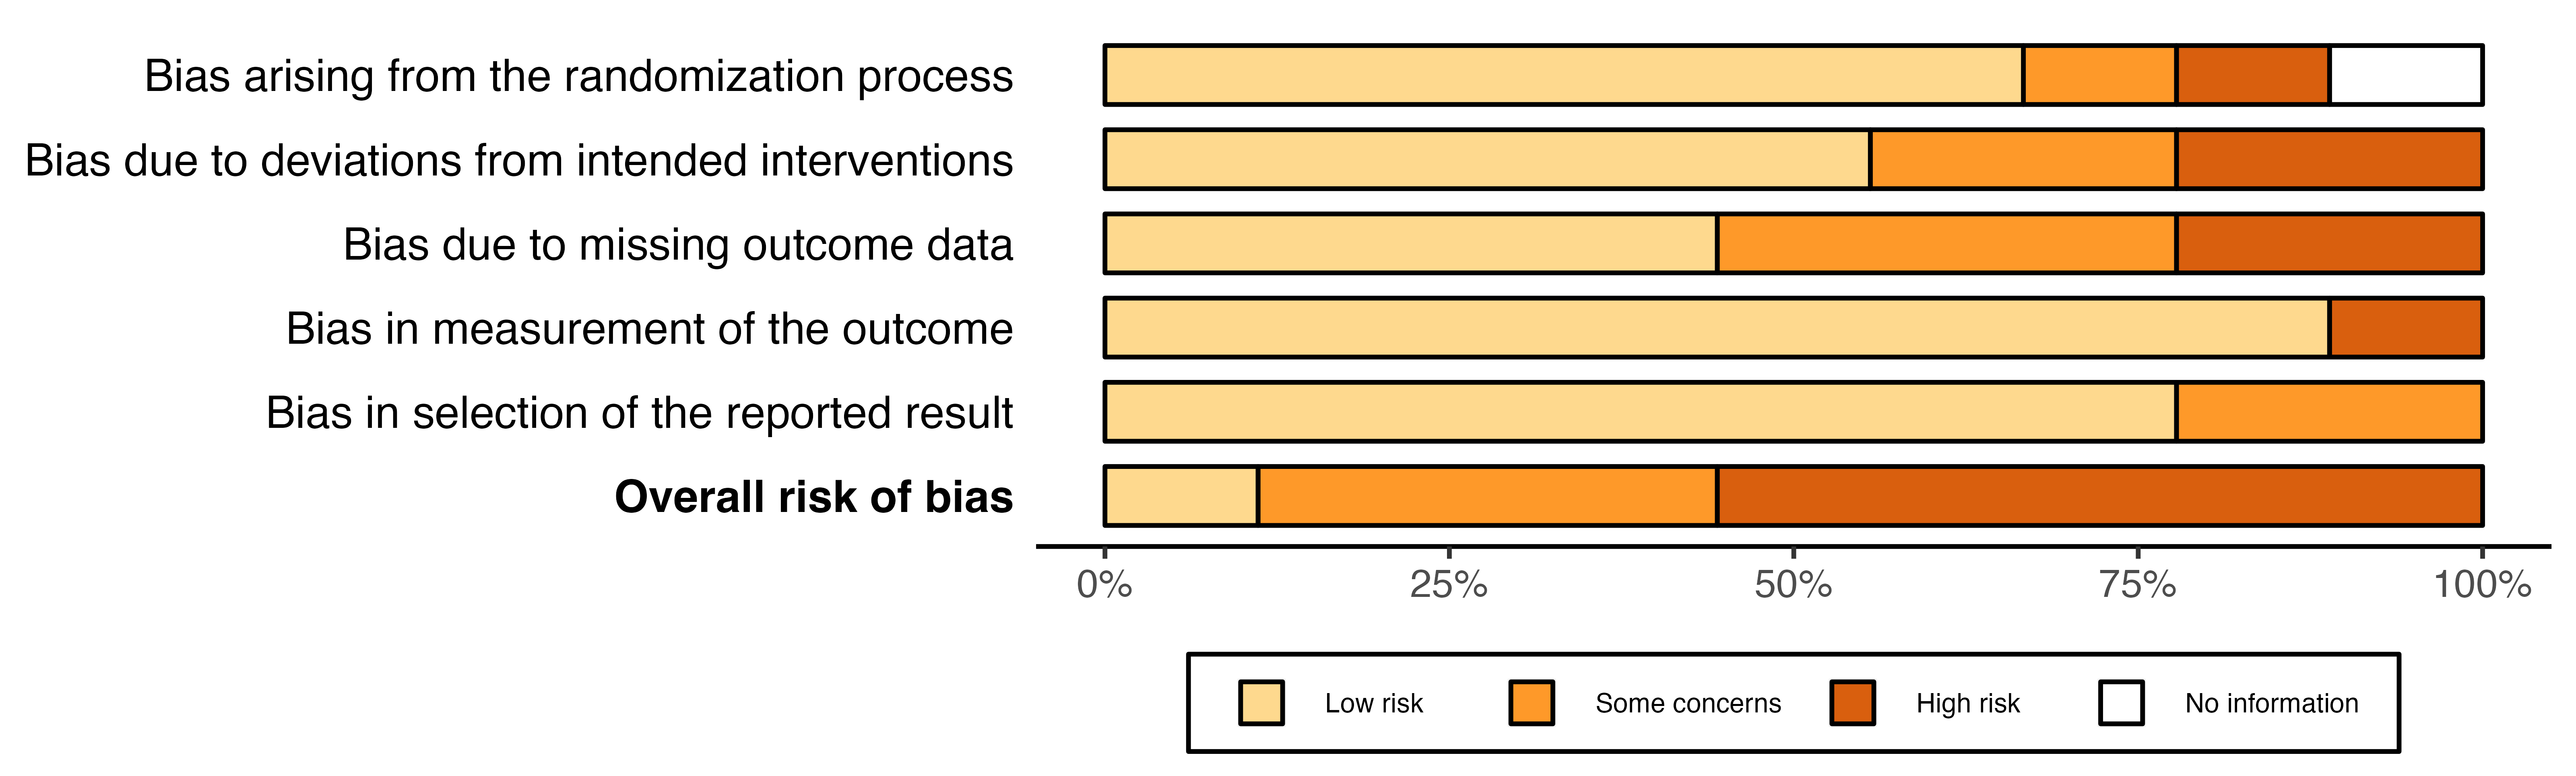
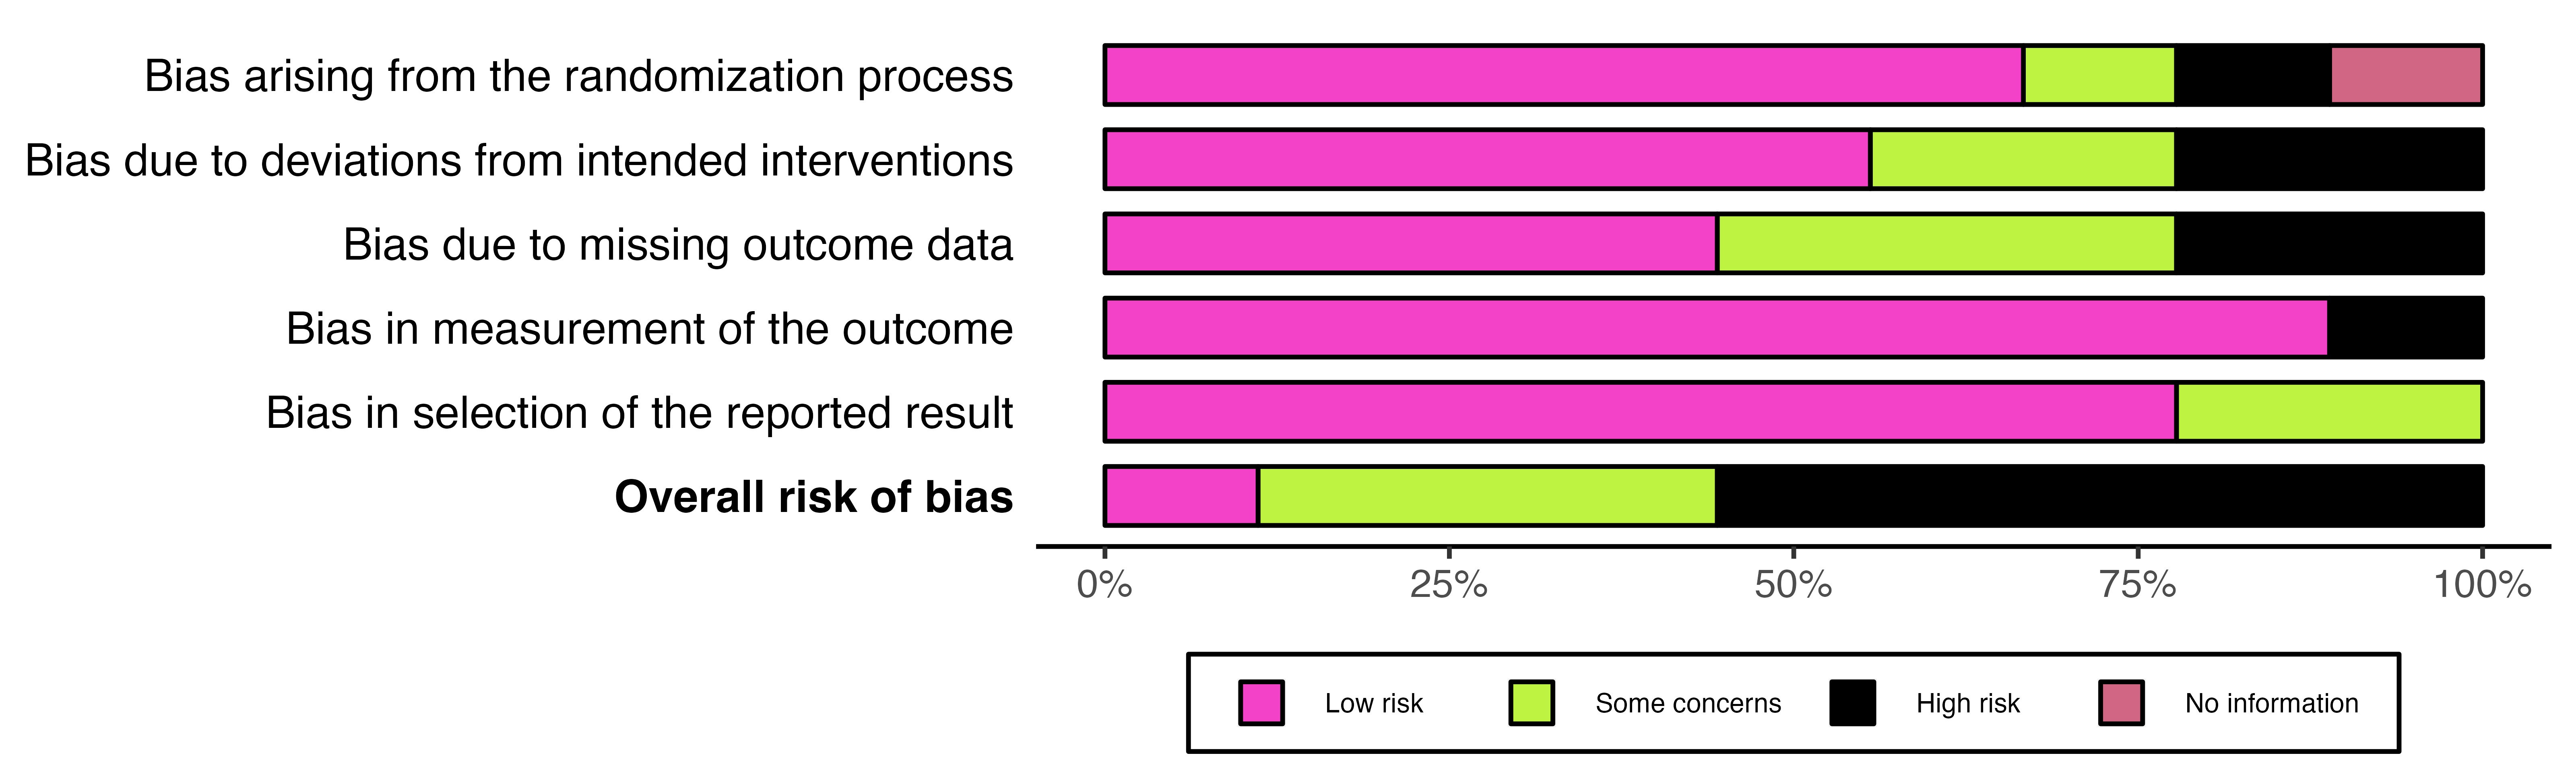
And to define your own colour scheme:
rob_summary(
  data = data_rob2,
  tool = "ROB2",
  colour = c("#f442c8",
             "#bef441",
             "#000000",
             "#d16684")
)
No “Overall” judgement
By default, both functions include an “Overall” risk of bias domain. To prevent this, remove the overall column from your dataset and set overall = FALSE.
summary_rob <- rob_summary(data = data_rob2[1:6], tool = "ROB2", overall = FALSE)
summary_rob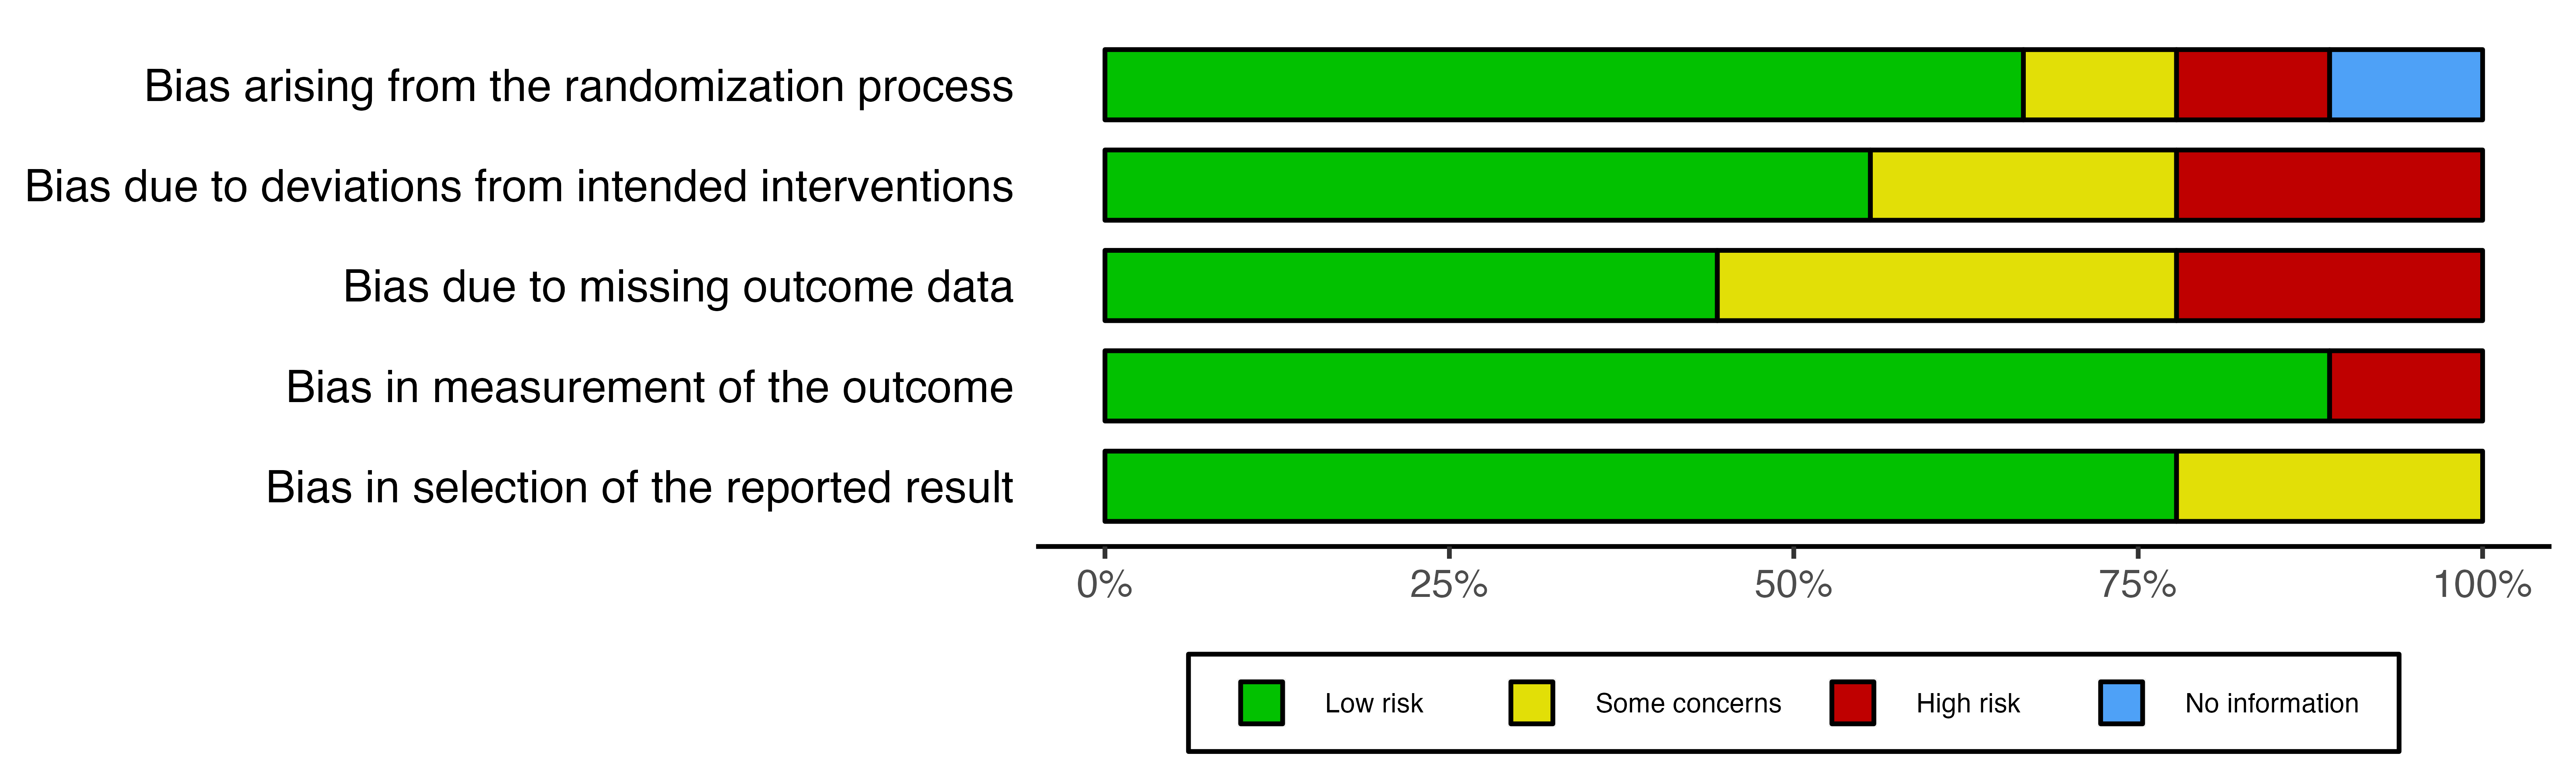
rob_traffic_light(data = data_rob2[1:6],
                  tool = "ROB2",
                  overall = FALSE)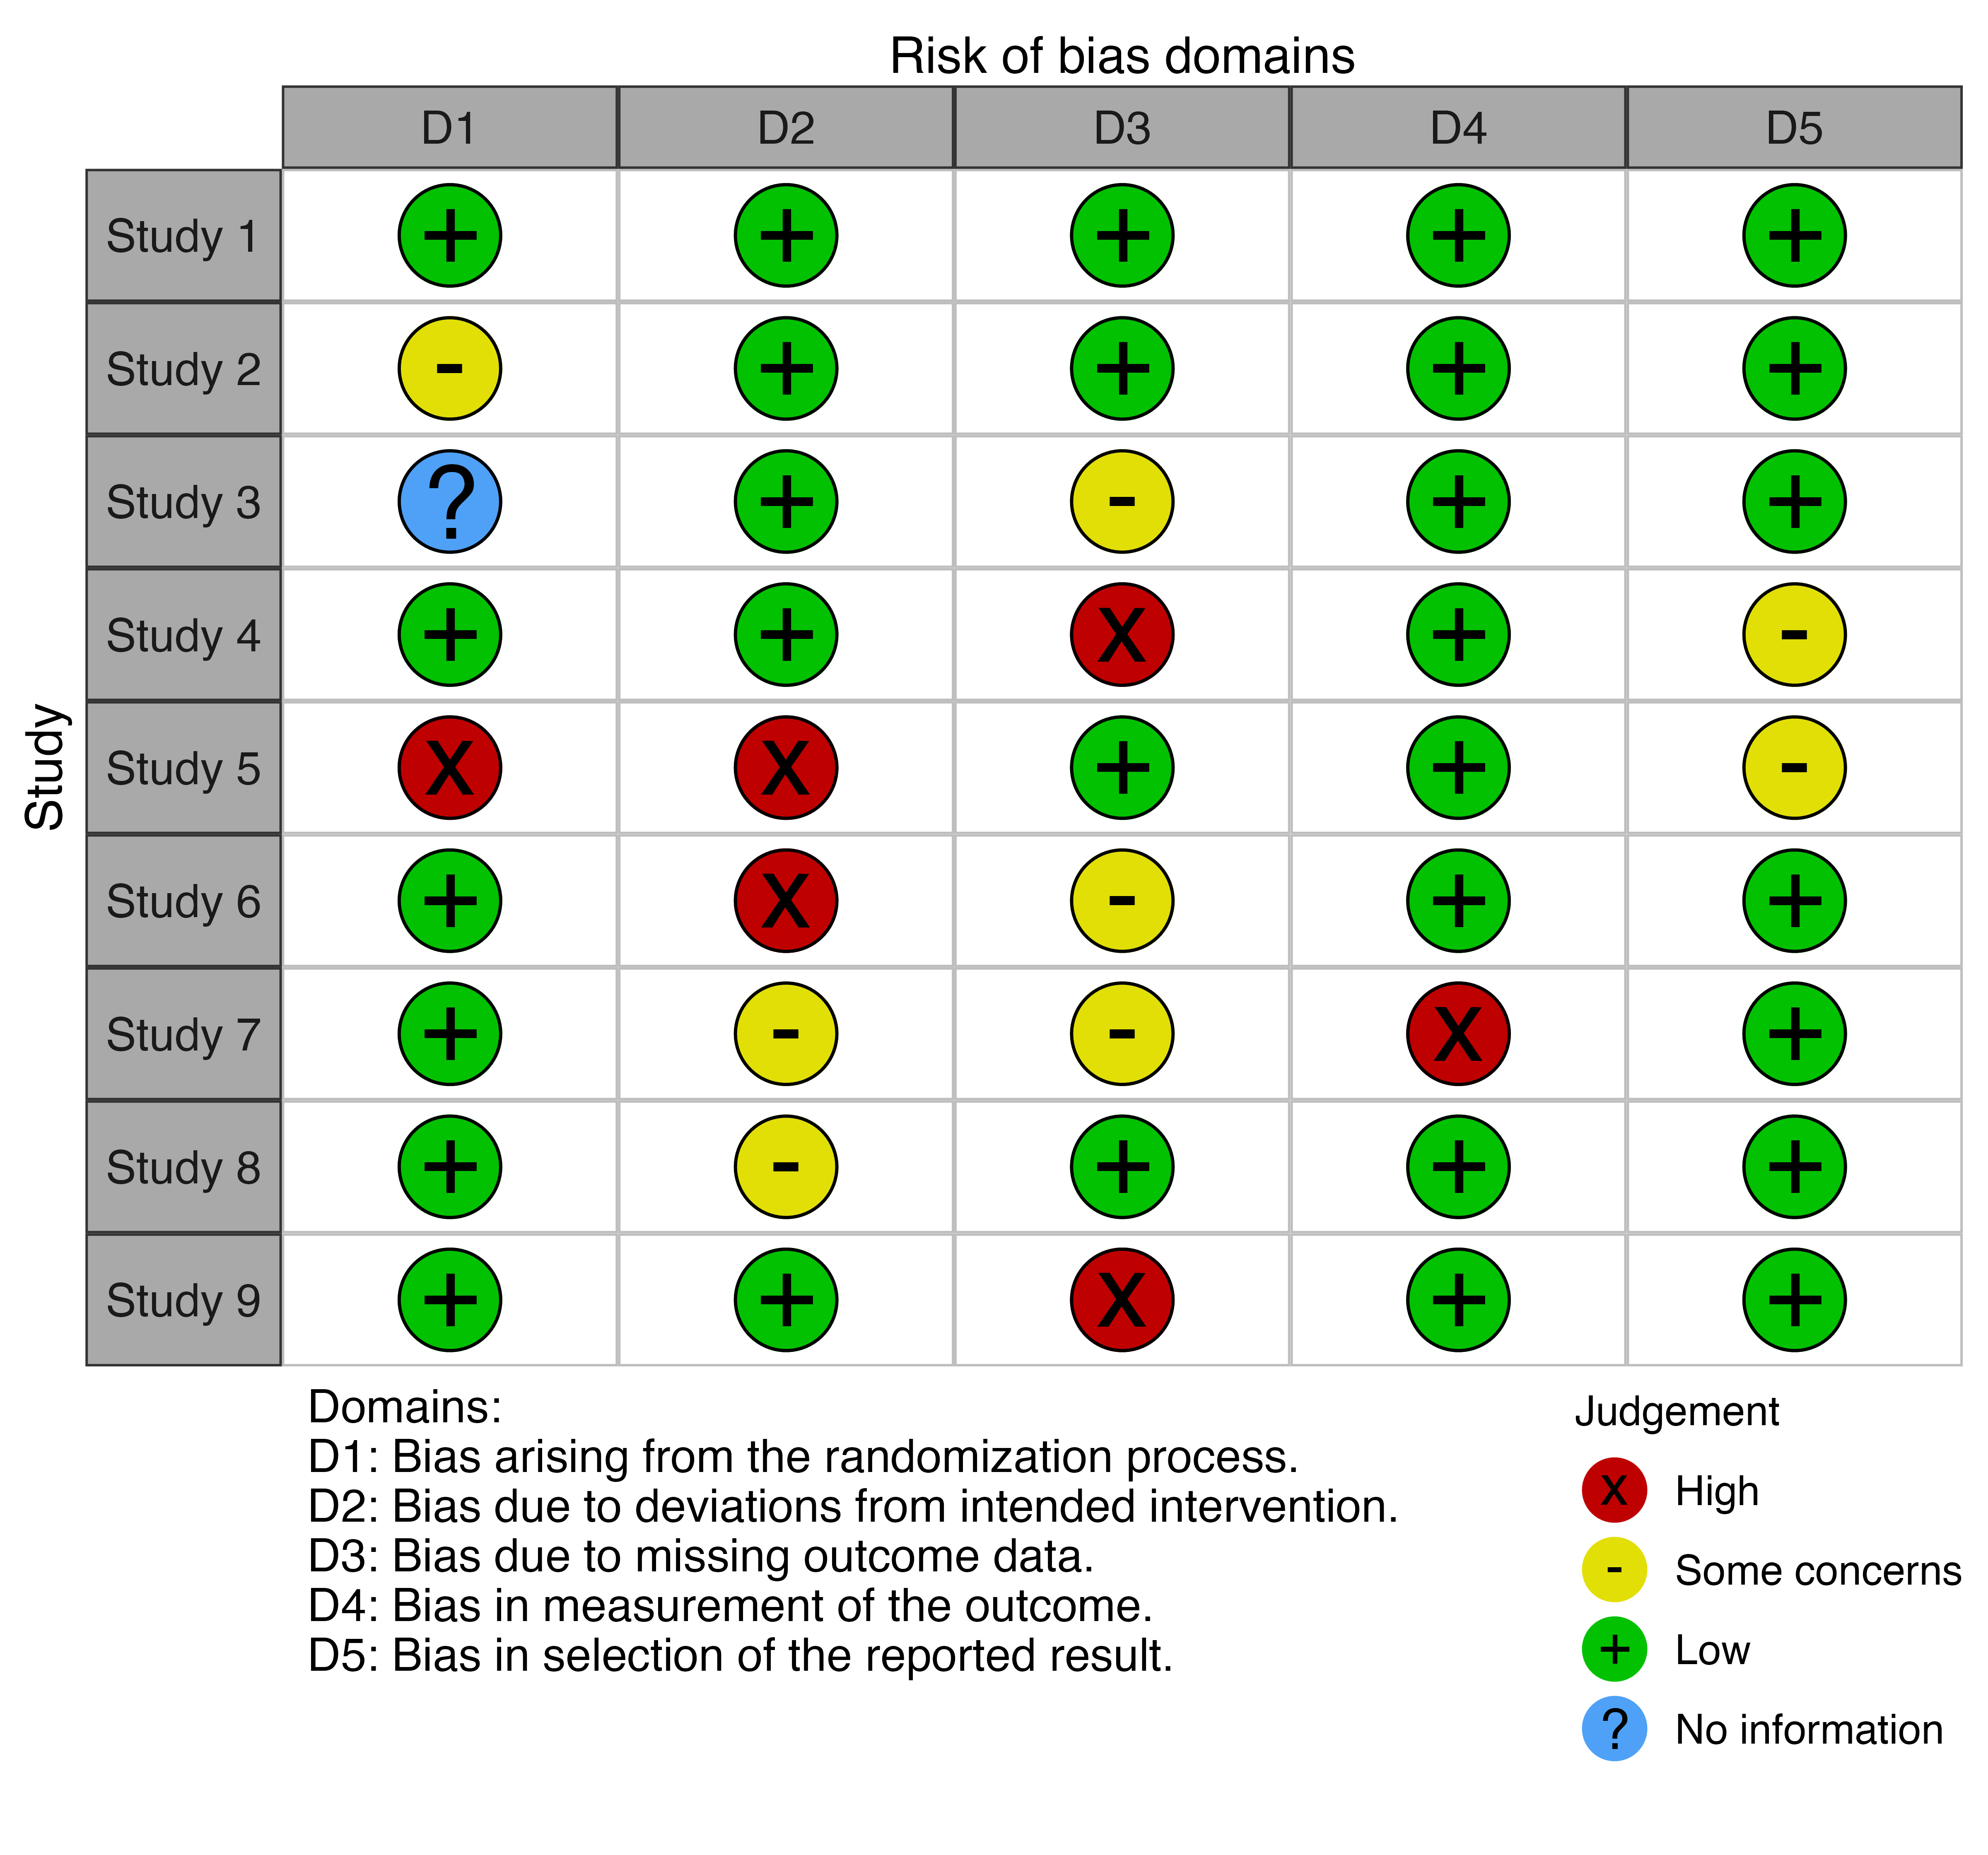
Editing the plots
Finally, because the output (summary_rob and trafficlight_rob in the examples above) is a ggplot2 object, it is easy to adjust the plot to your own preferences.
For example, to add a title:
library(ggplot2)

rob_summary(data = data_rob2, tool = "ROB2") +
  ggtitle("Summary of RoB 2.0 assessments")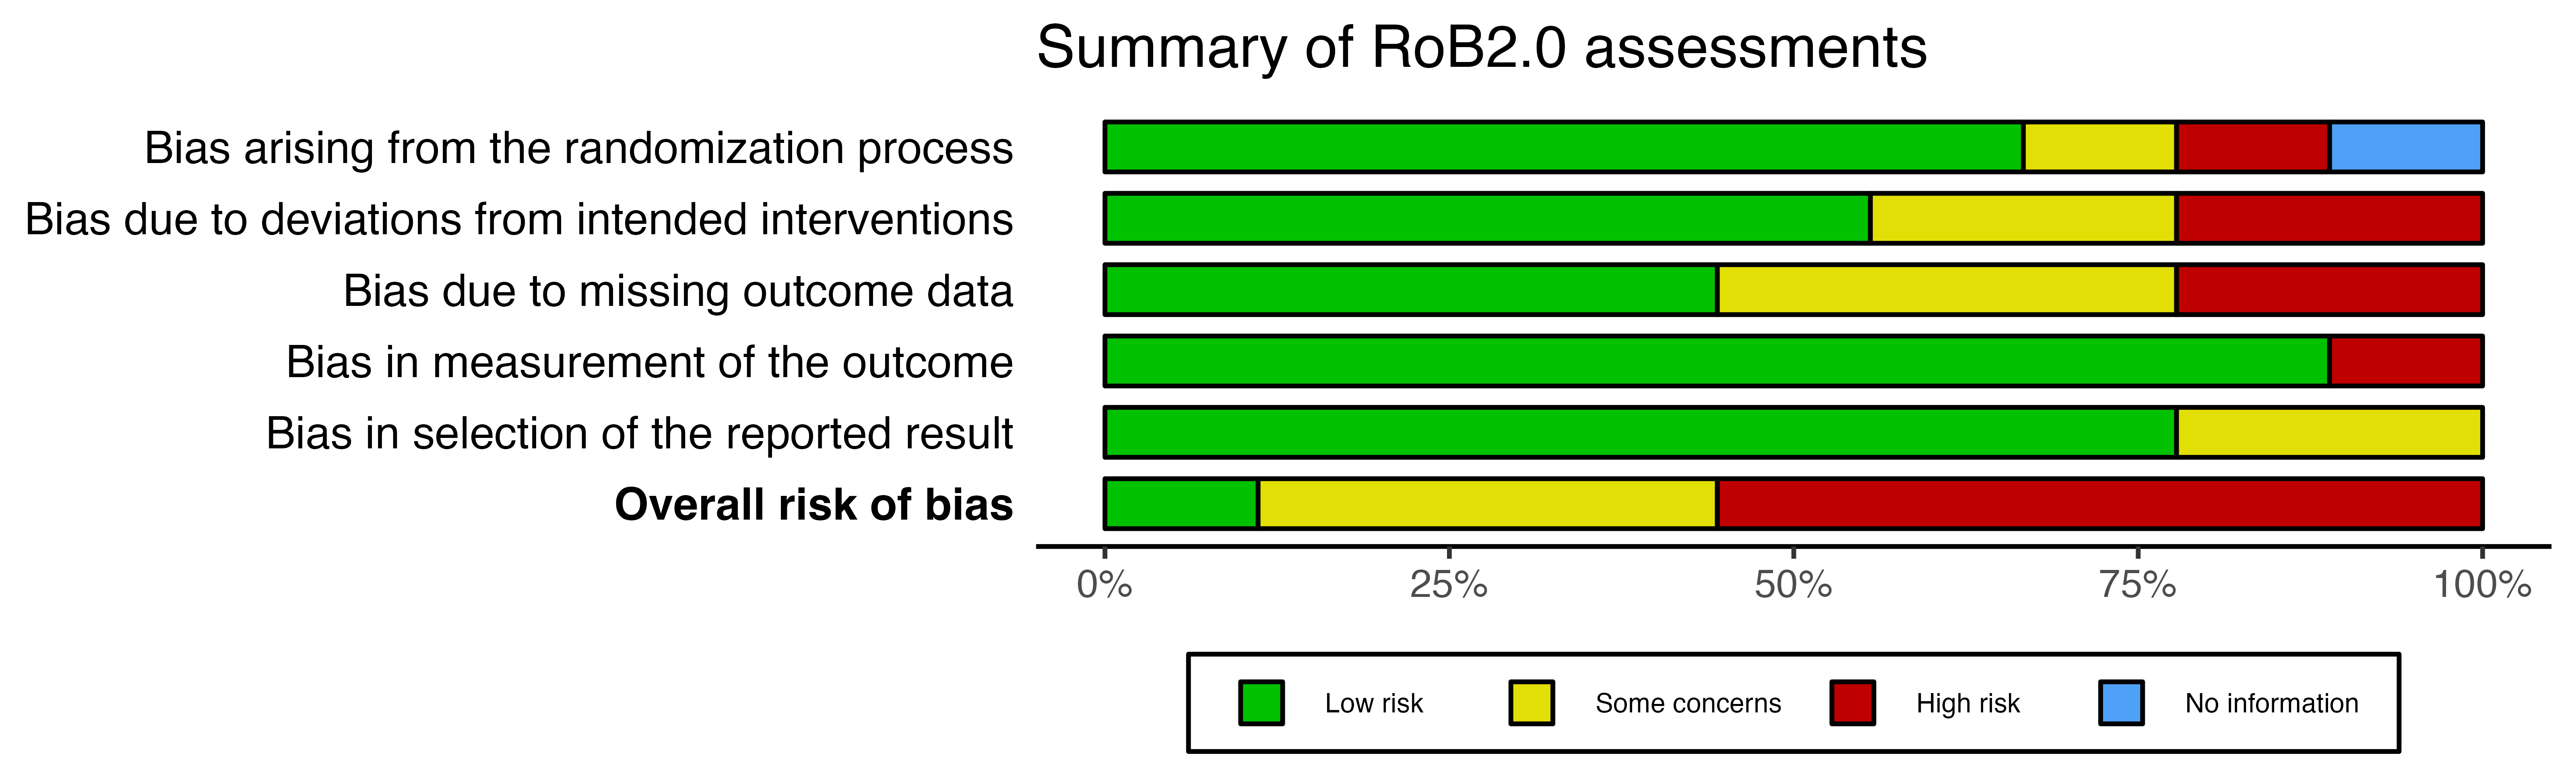
Examples of robvis in published papers
To date, robvis has been cited in more than 1500 academic articles - these can be explored here.
Code of conduct
Please note that the ‘robvis’ project is released with a Contributor Code of Conduct. By contributing to this project, you agree to abide by its terms.
License
This project is licensed under the MIT License - see the LICENSE.md file for details.
Acknowledgments
- The
rob_summary()function was based on code forwarded by a colleague. I recently discovered that this code was adapted from that presented in the wonderful “Doing Meta-Analysis in R” guide, so I would like to acknowledge the authors here. -
Emily Kothe for help in fixing
ggplot2coding issues. -
Eliza Grames for creating the
robvishex sticker.