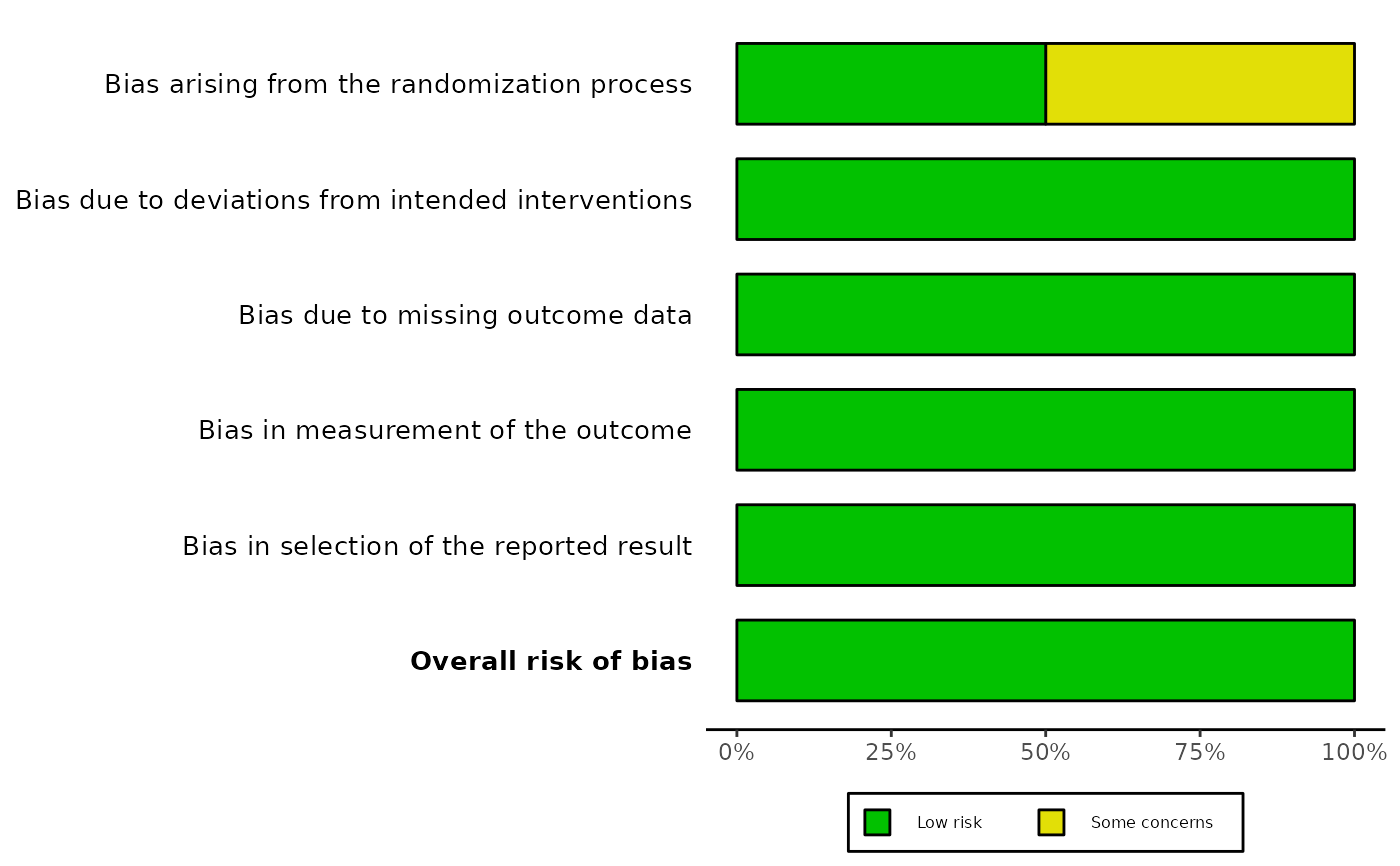
Produce summary weighted barplots of risk-of-bias assessments.
Source:R/rob_summary.R
rob_summary.RdA function to convert standard risk-of-bias output to tidy data and plot a summary barplot.
rob_summary(
  data,
  tool,
  overall = TRUE,
  weighted = FALSE,
  colour = "cochrane",
  ...
)
Arguments
- data
A dataframe containing summary (domain) level risk-of-bias assessments, with the first column containing the study details, the second column containing the first domain of your assessments, and the final column containing a weight to assign to each study. The function assumes that the data includes a column for overall risk-of-bias. For example, a ROB2.0 dataset would have 7 columns (1 for study details, 5 for domain level judgments, 1 for overall judgements, in that order).
- tool
The risk of bias assessment tool used. RoB2.0 (tool='ROB2'), ROBINS-I (tool='ROBINS-I'), and QUADAS-2 (tool='QUADAS-2') are currently supported.
- overall
An option to include a bar for overall risk-of-bias in the figure. Default is TRUE
- weighted
An option to specify whether weights should be used in the barplot. Default is FALSE.
- colour
An argument to specify the colour scheme for the plot. Default is 'cochrane' which used the ubiquitous Cochrane colours, while a preset option for a colour-blind friendly palette is also available (colour = 'colourblind').
- ...
Arguments to be passed to the tool specific functions.
Value
Risk of bias assessment barplot figure.
See also
Other main:
rob_forest(),
rob_traffic_light()